Member-only story
Trigger Azure Function from Azure Monitor alerts
Azure Monitor alerts are a great way of getting notified of any threshold breach of your resource metrics and helps to keep a tab on the health of the Azure resources in a timely manner. Wouldn’t it be great if the follow-up action for the alert is also taken care of !!? Oh yes, keep reading on please…
Azure Monitor alerts gives us the option of triggering an Azure Function as a follow-up action.
For illustration purposes let us consider setting up a ‘Heartbeat’ alert for an Azure Virtual Machine (VM). Heartbeat is a great way to know if your Virtual machine is ‘alive’ , you would have a Heartbeat entry in your Log Analytics workspace every minute or so.
Steps
- Go to your VM resource and enable ‘Insights’ from the portal to flow through to the Log Analytics workspace
- Browse to Azure Monitor → Alerts → +New Alert Rule
- Select a specific scope of alert, in this case Log analytics workspace/VM
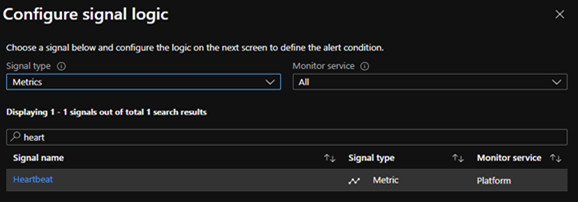
- Search for the “Heartbeat” metric and set the Alert logic as required

5. Create a new action group to trigger the Azure Function app. It is ideal to use a dedicated Service Principal in your Function for authenticating into Azure.
6. Under ‘Networking’ of the Function app add the service tag “Action Group” to the allowed list like below:
When you create the new rule, select “Service tag(preview)” as the Type and ActionGroup as the service tag. This will ensure all current and future source IPs for Action Groups will be allowed to trigger the Function app.
Also ensure that the Storage account associated to the Function app is accessible by Azure Monitor alerts.
If you found this blog helpful please do give a clap and follow me for more on Microsoft Azure & Google Cloud
Also consider joining the Medium membership through my referral link for unlocking a load of awesome articles !!!
That’s it ! You now have setup automated alert and remediation using Azure Monitor!!!
Additional information
You could base your alerts on Azure Monitor metrics/ Log Analytics Workspace metrics/ Log Analytics Workspace saved queries etc. The example I have described above was the one I used to start a backup Virtual Machine (VM) when, for some reason, my primary VM becomes in-accessible.
Another use case would be to monitor your VM ‘Available memory’ consumption to take remedial action. For the ‘Available memory’ alert below query needs to be saved in the Log Analytics workspace used for alerting:
InsightsMetrics
| where Origin == "vm.azm.ms"
| where Namespace == "Memory" and Name == "AvailableMB"
| extend TotalMemory = toreal(todynamic(Tags)["vm.azm.ms/memorySizeMB"])
| extend AvailableMemoryPercentage = (toreal(Val) / TotalMemory) * 100.0
| summarize AggregatedValue = avg(AvailableMemoryPercentage) by bin(TimeGenerated, 15m), Computer, _ResourceId